

Predicting Titanic survivors with Explorer and ML 🧊🛳️ (template)
Mix.install([
  {:scholar, "~> 0.2.1"},
  {:explorer, "~> 0.7.1"},
  {:exgboost, "~> 0.3"},
  {:kino_explorer, "~> 0.1.12"},
  {:kino_vega_lite, "~> 0.1.10"}
])
✋ Before starting…
- Kaggle https://www.kaggle.com/competitions/titanic/data
- No Slides Conf talk by Ju Liu (@arkh4m) https://youtu.be/YhZXU5zUnO0?si=4njVBZJ9q5j0zYRP
📦 Importing Data
With Livebook you can simply drag a file to import its content…
🧭 Exploring the dataset
Survived distributions (0 = NO, 1 = YES)
Age with regard to Survived
Class distribution
Class density (KDE)
it’s a technique that let’s you create a smooth curve given a set of data.
https://towardsdatascience.com/kernel-density-estimation-explained-step-by-step-7cc5b5bc4517
Sex distribution
Survived with regard to Sex
Survived density with regard to Class
Combining Sex and Class
🧠 Use intuition to predict survivors
Random
50% chances of guessing the right answer
Based on Sex value
The assumption is
- Women survive
- Men do not survive
📈 Linear and Polynomial Regression to predict survivors
Prepare the data
- Fill missing values
- Categorize columns (from string to integer values)
Linear Regression
Build target tensor
Build features tensor
Classifier
Check accuracy of our trained classifier (aka model)
Polynomial regression
From linear to polynomial (NOTE: the classifier is still the same, just the “features” have been changed)
Check accuracy of our trained classifier (aka model)
🌲 Decision Tree to predict survivors
https://eight2late.files.wordpress.com/2016/02/7214525854_733237dd83_z1.jpg
Build features tensor
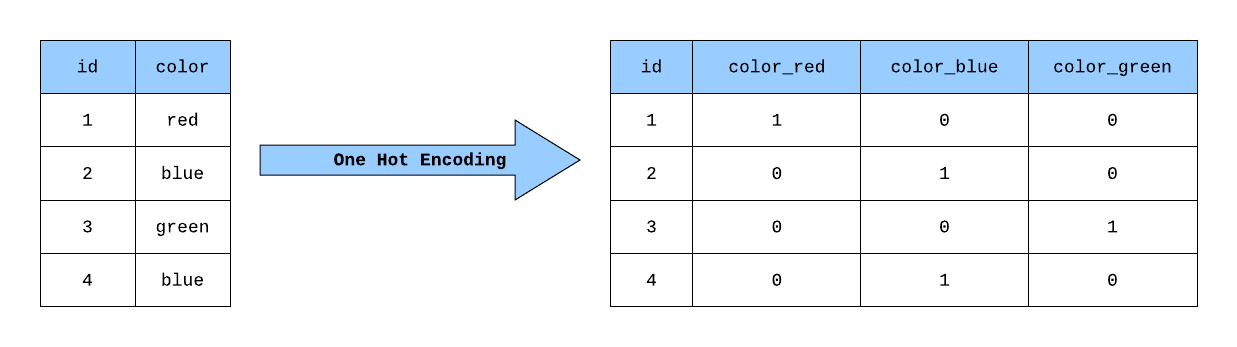
Build target tensor and hot-encode it (https://projects.volkamerlab.org/teachopencadd/_images/OneHotEncoding_eg.png)
Build the Decision Tree and check its accuracy
⚔️ Avoid overfitting with cross-validation
https://notes.club/elixir-nx/scholar/notebooks/cv_gradient_boosting_tree
🎨 Plot the Decision Tree
# # https://stackoverflow.com/questions/60186747/how-do-i-include-feature-names-in-the-plot-tree-function-from-the-xgboost-librar
# ["Pclass", "Age", "Sex", "SibSp", "Parch", "Fare", "Embarked"]
# |> Enum.with_index(fn element, index -> "#{index} #{element} q" end)
# |> Enum.join("\n")
# |> then(&File.write!("/Users/nicolo.gnudi/fmap.txt", &1))

# EXGBoost.Booster.get_dump(model, fmap: "/Users/nicolo.gnudi/fmap.txt", format: :json)
# |> Jason.Formatter.pretty_print()
# # |> then(& File.write!("/Users/nicolo.gnudi/dt.json", &1))
Export model and import it in Python for plotting
https://github.com/acalejos/exgboost/issues/29
# # Dump the model
# EXGBoost.write_weights(model, "/Users/nicolo.gnudi/dtw")
Then, install the required Python packages
pip3 install xgboost
pip3 install graphviz
And finally plot the Decision Tree
❯ python3

>>> import xgboost as xgb
>>> model = xgb.Booster()
>>> model.load_model("/Users/nicolo.gnudi/dtw.json")
>>> g = xgb.to_graphviz(model, fmap="/Users/nicolo.gnudi/fmap.txt")
>>> g.render(filename="/Users/nicolo.gnudi/dtg")
'/Users/nicolo.gnudi/dtg.pdf'


